
Meta shows you more than 100 metrics inside Ads Manager. Most of them are noise. I have watched smart students at Digital Scholar freeze in front of that dashboard, scrolling columns, trying to make sense of 75 numbers, and end up understanding none of them. That is analysis paralysis, and it kills more ad accounts than a bad creative ever will.
Here is the truth I teach on day one of the ads module. You only need 12 metrics. Twelve. If you can read these 12 numbers and know what to do when one of them moves, you can run a Meta account better than most agency employees who have been doing this for three years. At echoVME we manage over 500 brands, and my team lives inside these same 12 columns.
This post is the exact dashboard. What each metric means, the benchmark that tells you if it is good or bad, and the one action to take when it goes wrong. No jargon for the sake of it. Let me be blunt: bookmark this, keep it open next to Ads Manager, and you will never feel lost in that screen again.
In this guide you will learn the 12 Meta Ads metrics that actually matter, why Meta charges for impressions and not results, how to read CPM, CTR, frequency, and cost per result, and the two video metrics almost nobody tracks (hook rate and hold rate) that separate scaling accounts from stuck ones.
TL;DR: The 12 Meta Ads Metrics That Matter
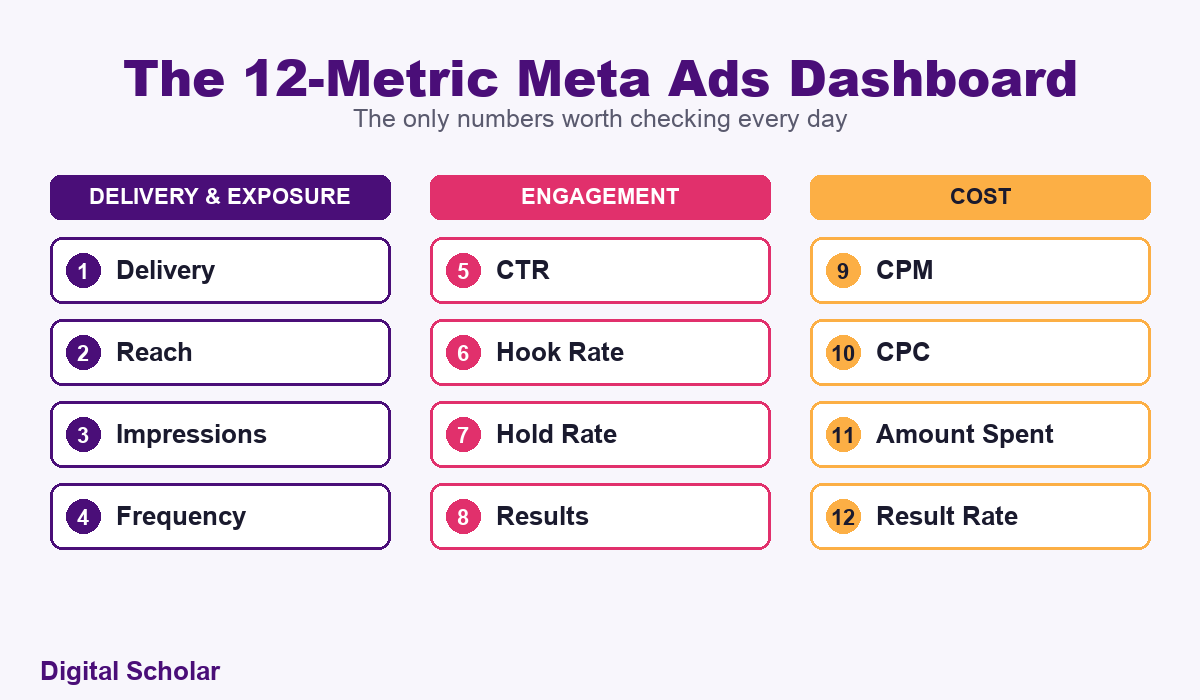
Meta Ads metrics boil down to 12 numbers you check daily: Delivery, Reach, Impressions, Frequency, CTR, CPM, CPC, Amount Spent, Results, Result Rate (CPL or CPA), Hook Rate, and Hold Rate. Everything else is a distraction. The core mental model: Meta charges you for impressions (CPM), so your whole job is to make ads engaging enough that Meta shows them cheaply.
- CPM is the master metric. Lower CPM means a more engaging ad. Bring it down and everything else improves.
- CTR under 0.6 percent means your ad or offer is confusing. Fix the message.
- Frequency of 2 to 4 per week is the sweet spot. Above 5 to 6, people get annoyed and you refresh the creative.
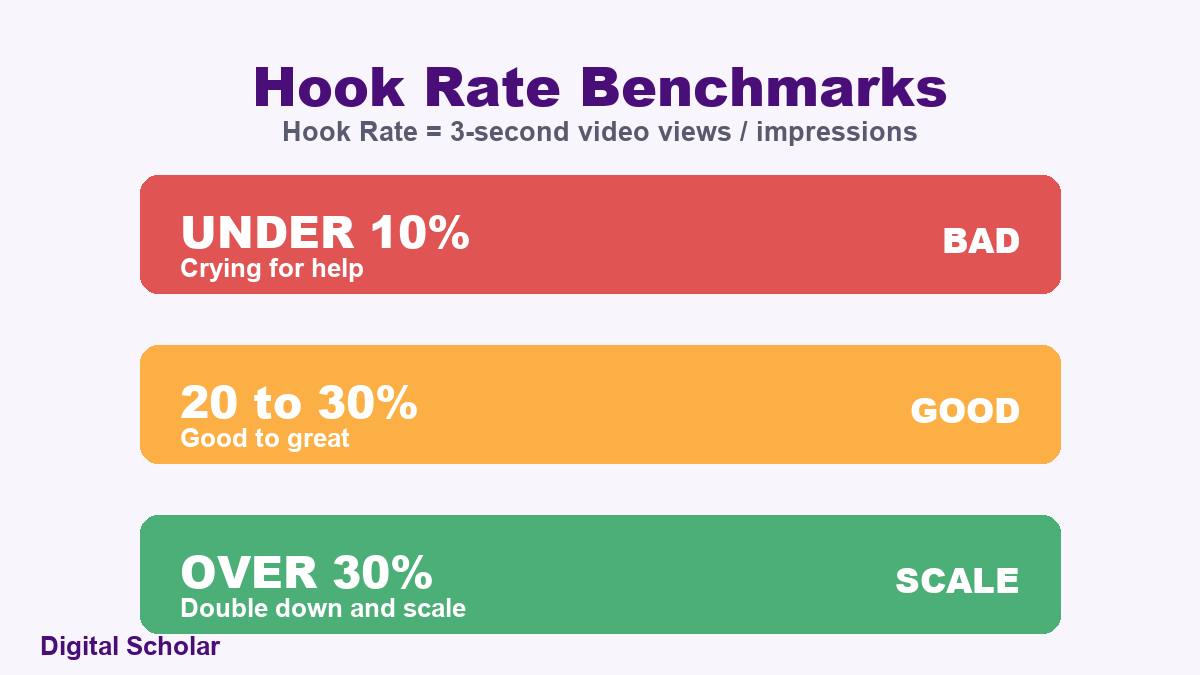
- Hook Rate (3-second views divided by impressions) tells you if your first 3 seconds work. Under 10 percent is a cry for help, 20 to 30 percent is good.
- Do not touch a campaign in the learning phase. It needs about 50 results in a week to stabilise.
Who this is for: business owners and marketers who run Meta ads but cannot confidently say whether their numbers are good or bad. If you have ever stared at Ads Manager and felt lost, this is your map.
- TL;DR: The 12 metrics that matter
- Why listen to me on this
- Start here: Meta charges for impressions, not results
- The 12-metric dashboard at a glance
- Delivery and the learning phase
- Reach, impressions and frequency
- CTR: your ad’s first honesty test
- CPM: the number your whole job is to lower
- Cost metrics: CPC, spend, results, result rate
- Hook rate: the thumb-stop ratio
- Hold rate: did they actually watch
- How to read the dashboard without fooling yourself
- FAQ
Why Listen to Me on This
I run echoVME Digital, an agency that has managed more than 500 brands and roughly Rs 400 crore in cumulative ad spend. I co-founded Digital Scholar, where over 1,000 students a year learn to run these accounts. I read these 12 metrics every single day, on my own Digital Scholar campaigns and across client accounts my echoVME team manages.
Here is my imperfect truth. For years I over-monitored. I tracked 30 metrics, built giant custom reports, and confused myself into bad decisions, like turning off ads that were still in their learning phase. The 12-metric discipline came from realising that more data was making me worse, not better. This post is the version of the dashboard I wish someone had handed me in 2018.
If you have not built the account underneath these metrics yet, read my guide to Meta Ads campaign structure first, then come back here to learn how to read what it produces. And if you want the wider context, my explainer on what performance marketing actually is sets the stage.
Start Here: Meta Charges for Impressions, Not Results
Before any metric makes sense, you have to understand what you are actually paying for. Meta does not charge you per lead, per click, or per sale. Meta charges you for impressions, billed as CPM, which is cost per 1,000 impressions. The M stands for mille, Latin for thousand. What happens after the impression is your problem, not Meta’s.
This one fact reorganises everything. If Meta charges per 1,000 views, then your entire job as a marketer is to make Meta want to show your ad cheaply. Meta shows engaging ads more cheaply because engaging ads keep people on the platform. Boring ads get punished with a high CPM. So the whole game becomes: do not bore the audience.
The key insight: you cannot directly control your cost per lead. You can only control how engaging your ad is, which lowers your CPM, which then lowers your cost per lead. Work on the input, not the output.
The 12-Metric Dashboard at a Glance
Here is the full dashboard in one table. You build it inside Ads Manager through Columns, then Customise Columns. Add these 12, save the view, and never scroll past them again.
| Metric | What it tells you | Healthy signal |
|---|---|---|
| Delivery | Is the ad learning, active, or limited | Active (green) |
| Reach | Unique people reached | Grows with spend |
| Impressions | Total times shown | Higher than reach |
| Frequency | Impressions per person | 2 to 4 per week |
| CTR | Percent who clicked | Above 1 percent |
| CPM | Cost per 1,000 impressions | Lower is better |
| CPC | Cost per click | Context-dependent |
| Amount Spent | Total budget used | Matches your plan |
| Results | Leads, sales, or views | Grows steadily |
| Result Rate (CPL/CPA) | Cost per result | At or below industry average |
| Hook Rate | 3-second views over impressions | 20 to 30 percent |
| Hold Rate | ThruPlays over 3-second views | Higher is better |
Delivery and the Learning Phase
Delivery is the status of your ad, and it is the first thing to check. It moves through stages: Off, In Draft, Learning, Learning Limited, and Active. Green Active is where you want to be. The one that trips people up is the Learning phase.
In the learning phase, Meta is testing which audiences, placements, and creatives work. Results are wildly unstable. To exit learning and stabilise, an ad set needs roughly 50 results within a week, which means 50 leads for a lead campaign, 50 sales for a sales campaign, or 50 installs for an app campaign. Think of a DJ testing Bollywood, then English, then Tamil tracks to find which one makes the crowd raise their hands. That is Meta during learning.
The rule that saves accounts: do not poke the engine during learning. Do not change the budget, do not swap creatives, do not turn it off and on. Every edit resets the learning phase and wastes your money. If you see Learning Limited, it usually means your budget is too small for Meta to gather 50 results in a week. The fix is to reverse-engineer it: if your expected CPL is Rs 500, then 50 results times Rs 500 is Rs 25,000, divided by 7 days is about Rs 4,000 per day minimum.
One honest update. With Meta’s newer AI-driven delivery, ads often go Active almost immediately, so the strict 50-result idea is fading. But the discipline still holds: give a new ad set stability before you judge it. At echoVME we make it a hard rule that nobody edits an ad set while it is still in learning, no matter how tempting the early numbers look.
Reach, Impressions and Frequency
These three describe how your ad spreads. Reach is the number of unique people who saw it. Impressions is the total number of times it was shown, including repeats. Frequency is simply impressions divided by reach, or how many times the average person saw your ad.
The numbers move very differently by objective. On a sales campaign, I have seen Rs 50 lakh of spend reach about 31 lakh people, because Meta is hunting only for buyers, which is slow and expensive. On an awareness campaign in Chennai, Rs 10,000 reached 2.4 million people, because the goal was cheap eyeballs. Same platform, completely different physics. If you are unsure which objective to run, my breakdown of the performance marketing funnel explains when each one fits.
Frequency is the one to babysit. The sweet spot is 2 to 4 exposures per week. Below 2, people forget you before they act. Above 5 or 6, annoyance and ad fatigue set in, your CTR drops, and your CPM climbs. When frequency creeps past that ceiling, it is not a targeting problem, it is a creative problem. Refresh the ad.
| Frequency | What it means | Action |
|---|---|---|
| Below 2 | Not enough repetition | Let it run or raise budget |
| 2 to 4 | Healthy sweet spot | Leave it alone |
| 5 and above | Fatigue setting in | Refresh the creative |
CTR: Your Ad’s First Honesty Test
CTR, or click-through rate, is the percentage of people who saw your ad and clicked through to your destination, whether that is an instant form, a website, or a WhatsApp chat. It is the fastest honesty test for whether your ad and offer connect.
My rough benchmark: a CTR between 0 and 0.6 percent means the ad is genuinely bad, and under 1 percent is weak. When CTR is that low, the cause is almost always the message, not the targeting. The offer is confusing, the copy is trying too hard to sound clever, or the creative is buried in jargon. One of my Digital Scholar students once ran a ring light ad where the word “free” was worded so badly that it pulled in junk leads at 3 to 4 rupees each. The targeting was fine. The sentence was broken.
The key insight: a low CTR is a communication problem 90 percent of the time. Before you touch the audience, rewrite the first line and the offer.
CPM: The Number Your Whole Job Is to Lower
CPM is cost per 1,000 impressions, and as I said at the top, it is the master metric. A lower CPM means Meta finds your ad engaging and rewards you with cheaper reach. A higher CPM means Meta thinks your ad is boring and makes you pay more to interrupt people.
Here is a real example of why it matters. Imagine two advertisers running the same offer. I run mine at a Rs 100 CPM and a competitor runs theirs at Rs 300. For the same budget, I get three times the impressions. Three times the chances to convert, for the same money, purely because my ad was more engaging. I have kept a campaign live at a Rs 254 CPM and switched off a near-identical one at Rs 540, because paying double for the same 1,000 views made no sense.
How do you actually lower CPM? Make ads people do not scroll past. Humour and meme-style ads work. A bold or slightly polarising stand works. Even a deliberate spelling mistake can work, because the grammar police jump into your comments and that engagement signals to Meta that your ad is interesting. Meta rewards you for not boring its users. One caution though: also watch ad cost inflation overall. Meta has raised ad costs by roughly 20 percent year on year, so a lead that cost 100 dollars last year can cost 120 this year even with a good ad.
Cost Metrics: CPC, Spend, Results and Result Rate
Four metrics track your money and what it buys. CPC is cost per click, useful to know but not a headline number today. Amount Spent is your total budget used, which should match your plan. Results is the count of what you optimised for: leads, sales, or views. Result Rate, better known as CPL (cost per lead) or CPA (cost per acquisition), is Amount Spent divided by Results, and it is the number most business owners actually care about.
The trap with CPL is judging it without an industry benchmark. A Rs 500 lead is a disaster for a course and a bargain for real estate. Here are the ranges I see across our echoVME accounts, so you have a reference point.
| Industry | Typical CPL range | Note |
|---|---|---|
| Education / courses | Rs 120 to 170 | Our Digital Scholar range |
| Weight loss / wellness | Rs 200 to 250 | Higher because of heavy scale |
| Real estate | Rs 400 to 700 | High-ticket, longer decision |
One counter-intuitive rule from years of data: spend less and leads get cheaper, spend more and leads get more expensive. When we scale a weight-loss client to 25 to 30 lakh a month, the CPL sits around Rs 200 to 250, higher than a small campaign, because Meta has to reach deeper into less obvious audiences to spend that much. And remember, a cheap lead is not always a good lead. I once ran a creative asking for “10 business owners to spend 120 hours” that pulled leads at Rs 60 to 70, brilliant on paper, but they thought it was consulting and did not convert. I cut it. Cost per result only matters next to quality, which is why I pair it with the tracking system in my guide to Meta Ads retargeting and the Pixel. To turn CPL into a real profit decision, run it through my break-even ROAS calculation.
Hook Rate: The Thumb-Stop Ratio
Hook rate is the metric that separates people who dabble in Meta ads from people who scale them. It is not in the default columns, so you have to build it as a custom metric. The formula is simple: 3-second video views divided by impressions. It measures how many people stopped scrolling for your first 3 seconds. It only applies to video.
Human attention online is shorter than a goldfish, around 6 to 7 seconds, and the fight is won or lost in the first 3. Here are the benchmarks I hold my own creatives to. Under 10 percent, the ad is crying for help and the hook needs rebuilding. Between 20 and 30 percent is good to great. Above 30 percent, double down and scale it. To be honest, my own average across campaigns sits around 8.5 percent, with my best campaign near 19 to 20 percent, so I am always working on better hooks too.
The pros exploit this. Top creators build 3 different hooks (hook 1, hook 2, hook 3) on the same 20-second video body, test which hook earns the highest hook rate, then scale only the winner. This is the same logic behind my Meta Ads creative testing framework. The body of your video barely matters if the first 3 seconds do not stop the thumb.
Hold Rate: Did They Actually Watch
If hook rate measures whether people stopped, hold rate measures whether they stayed. The formula is ThruPlays divided by 3-second video views. A ThruPlay is a view of at least 15 seconds. So hold rate captures how many of the people you hooked actually held on through your message.
This is why I push every creative toward 20 to 25 seconds. Across echoVME video campaigns, that shorter cut consistently holds attention better than a 40 or 45 second version, which rarely converts unless you are a big brand or the ad is genuinely funny, because most people drop off long before the offer. If you run organic content too, read the retention graph to find the exact second people leave, then cut or fix that moment. A great hook with a weak hold is a leaky bucket. You paid to grab attention and then lost it.
The key insight: hook rate gets them to stop, hold rate keeps them watching, and only then does CTR get them to click. Diagnose your video in that order.
How to Read the Dashboard Without Fooling Yourself
Individual metrics lie. The skill is reading them together as a story. When a campaign underperforms, I walk the funnel in order and the numbers tell me exactly where it broke.
- Low hook rate? The first 3 seconds fail. Rebuild the opening of the video.
- Good hook rate but low hold rate? The middle drags. Cut the ad shorter and tighten the message.
- Good hold rate but low CTR? They watched but the offer or call to action is weak. Fix the ask.
- Good CTR but high CPL? The clicks are cheap but the leads are junk, or the landing page loses them. Check the destination.
- High CPM across the board? The whole creative is boring. This is a creative problem, not a budget problem.
Notice that almost every diagnosis points back to the creative, not the settings. That is the real lesson of the 12-metric dashboard. If your numbers keep pointing at a weak creative, my guide to Meta Ads creatives that convert shows how to fix the ad itself. Beginners obsess over targeting and budgets. Operators know that in a signal-based platform, the creative is the targeting, and these 12 numbers are how you find the weak link. If you want the full stack of tools we use to build and test those creatives, I list them in my guide to the best performance marketing tools and platforms, and if you are just starting out, my roadmap on how to learn performance marketing shows where metrics fit in the journey.
Want to read any ad account like a pro?
Our 4-month AI and Digital Marketing program at Digital Scholar trains you on live Meta accounts, reading these exact metrics and fixing campaigns the way we do at echoVME. You leave able to diagnose any dashboard in minutes.
Frequently Asked Questions
What is the most important Meta Ads metric?
CPM, or cost per 1,000 impressions, is the master metric because Meta charges you per impression, not per result. A low CPM means Meta finds your ad engaging and shows it cheaply, which pulls down your cost per lead automatically. You cannot directly control CPL, but you can control how engaging your creative is, and that controls CPM. At echoVME we treat lowering CPM as the core creative job, because everything downstream improves when it falls.
What is a good hook rate on Meta ads?
Hook rate is 3-second video views divided by impressions, and it measures whether your first 3 seconds stop the scroll. Under 10 percent is poor and the opening needs rebuilding. Between 20 and 30 percent is good to great. Above 30 percent, scale it. For honesty, my own campaigns average around 8.5 percent with a best of roughly 19 to 20 percent, so even experienced marketers keep working on hooks. Hook rate is a custom metric you have to build in Ads Manager yourself.
What is a good CTR for Facebook and Instagram ads?
As a rough rule, aim for a CTR above 1 percent. A CTR between 0 and 0.6 percent signals a genuinely weak ad, and the cause is almost always the message rather than the targeting. When CTR is low, rewrite your first line and simplify the offer before you touch the audience. A confusing offer or too much jargon is the usual culprit. CTR is your fastest signal of whether the ad and the offer actually connect with people.
What is the learning phase in Meta ads?
The learning phase is the period when Meta tests audiences, placements, and creatives to figure out who converts. Results are unstable during this time. An ad set traditionally needs about 50 results in a week to exit learning and stabilise. The critical rule is not to edit the ad set while it learns, because changing budget or creative resets the phase and wastes spend. With Meta’s newer AI delivery, ads often stabilise faster, but giving new ad sets stability still matters.
How often should I check my Meta ad metrics?
Check the 12 core metrics once a day, but resist the urge to make changes daily, especially during the learning phase. Daily monitoring is for spotting real problems like a spiking frequency or a collapsing CTR, not for constant tinkering. At Digital Scholar we look every morning but only act when a metric clearly breaks its benchmark. Over-editing is one of the most common ways beginners kill an account that was about to stabilise.
What is the difference between reach and impressions?
Reach is the number of unique people who saw your ad. Impressions is the total number of times it was shown, including the same person seeing it multiple times. If 100 people each see your ad 3 times, that is a reach of 100 and 300 impressions. Dividing impressions by reach gives you frequency, which should sit at 2 to 4 per week. Impressions will always be equal to or higher than reach.
Why is my cost per lead so high?
Walk the funnel backwards. A high CPL usually starts with a high CPM (a boring creative), a low CTR (a confusing offer), or a leaky landing page that loses people after the click. Also check your benchmark: Rs 500 is terrible for a course but normal for real estate. And remember that scaling spend raises CPL, because Meta reaches into less obvious audiences to spend more. Fix the creative and the offer first, since that is where most CPL problems are actually born.
Metrics are not about surveillance. They are about knowing which lever to pull next. Once you can read these 12 numbers, Meta stops being a slot machine and becomes a system you can actually steer.
Do one thing today: open Ads Manager, go to Customise Columns, and build this exact 12-metric view. Then build hook rate and hold rate as custom metrics. That single afternoon of setup will change how you see every campaign you run after it.
Twelve numbers. That is the whole game. Go read them.